There many terms in statistics to define the quality state of a process.
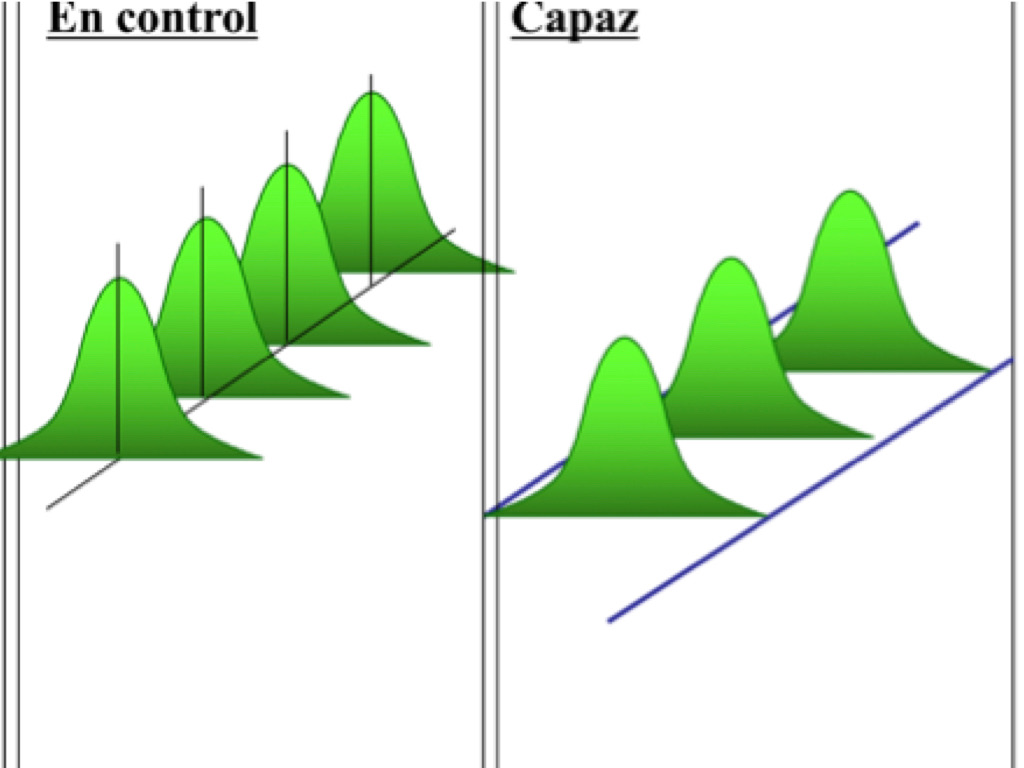
• The process can be out of control or in control. A process is in control when its shape and position are repetitively equal over time. It is out of control when either shape or position differs from time to time as we may observe in the figure below.

• The process can be capable or not capable. A process is capable when all of its data points are within the specification limits, time after time. The process is out of control when one or more of its data points are outside the specification limits, at any given time or repetitively. To be capable the process needs to be in control. We can represent these states by the following figure. It is fairly easy to demonstrate the capability of a process as this can be done through the capability indices Cp and Cpk

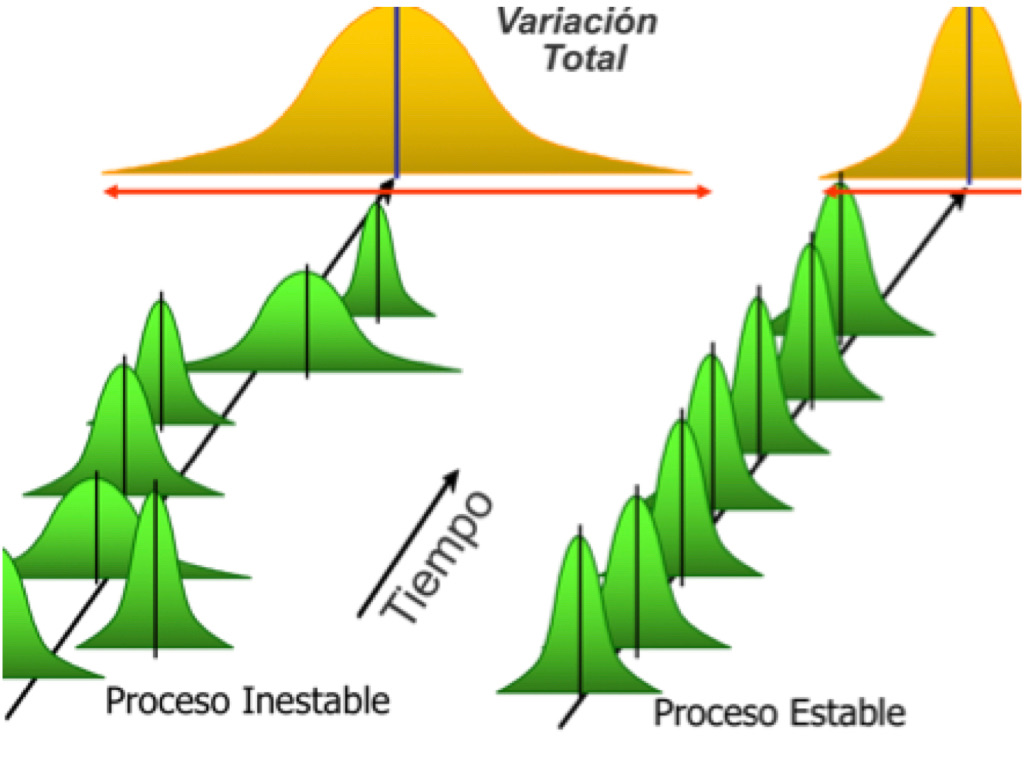
However our interest in this blog is the fact that a process can be stable or unstable. A process out of control is unstable and a process in control is said to be stable. The figure below illustrates these terms. Therefore for a process to be capable it must first be stable within a certain range of allowable shift, that is it can present certain level of instability but without going out of the specification limits. This shift range is typically 1.5 standard deviation. Stability is not like capability where at any particular time it can determine using indices and their formula.

Stability is a bit more complicated because there is not one formula to calculate it but a methodology to determine it. It is defined as the ability of the process to perform in a predictable manner over time. The tricky part is that a process can show good capability index today and tomorrow and not necessarily be stable next week. That is why there is a difference between short term capability using Cp and Cpk, and long term performance using Pp and Ppk. So how do we determine whether or not a process is stable?
Stability as we can observe in the above figure or as we can deduct by its definition (predictable performance over time), will have to consider two parameters: shape and position.
1. Shape will be determine by mean and variance. To be stable the process must offer constant means and constant variances, both over time. To study the consistency of variances of a process, one needs to use a scatter diagram of a sufficiently large amount of samples taking in order over a fairly long period of time. The diagram should look like a constant random variation (not positive nor negative correlation) around a constant mean, that is flat straight regression line (not positive, nor negative correlation). A large amount of samples would be at least 100. And a fair period of time would be at least 30 days.
2. Position is itself also a bit more sophisticated to determine. When we talk about position, it is relative to the specification limits. Therefore Cpk will be part of the study. Cpk is the relative position of the process mean to the upper or the lower specification limit depending upon which one is closer. But remember it must be by definition over time.
A. So to study position over time one needs to make a process distribution capability study over a fairly long period of time (daily during 30 days),
B. Calculate in particular Cpk everyday.
C. And use descriptive statistics to study the variation of the Cpk’s, since themselves they must not present a large coefficient of variation and probably be leptokurtic. That is the all point of the “predictable manner over time” definition. Indeed if the coefficient of variation of the 30 Cpk’s is large it means that the relative position is shifting too much from one Cpk to the other.
D. How much is too much shifting? 1.5 standard deviation is the answer. Therefore in determining the coefficient of variation which is equal to standard deviation divided by mean, it must be compare to the fraction of 1.5 standard deviation over mean. If the coefficient is greater than the 1.5 sigma fraction then there is too much variation and the process is not stable independently if shape was ok in the previous scatter diagram study.
As we can observe process Stability is not a simple matter. It requires time and offer some complexity as two different studies must be performed and if either one fails the stability fails, besides that the second study itself offers different ways of failing.
Stability should be obtained before any real process sustainable improvement can be obtained. This is true for any process but particularly fundamental for validation in pharmaceutical processes.
You may contact us at info@quantumtc.com to participate in a private coaching session to further explore with practical case studies this topic. Fees may be applied.
• The process can be out of control or in control. A process is in control when its shape and position are repetitively equal over time. It is out of control when either shape or position differs from time to time as we may observe in the figure below.

• The process can be capable or not capable. A process is capable when all of its data points are within the specification limits, time after time. The process is out of control when one or more of its data points are outside the specification limits, at any given time or repetitively. To be capable the process needs to be in control. We can represent these states by the following figure. It is fairly easy to demonstrate the capability of a process as this can be done through the capability indices Cp and Cpk

However our interest in this blog is the fact that a process can be stable or unstable. A process out of control is unstable and a process in control is said to be stable. The figure below illustrates these terms. Therefore for a process to be capable it must first be stable within a certain range of allowable shift, that is it can present certain level of instability but without going out of the specification limits. This shift range is typically 1.5 standard deviation. Stability is not like capability where at any particular time it can determine using indices and their formula.

Stability is a bit more complicated because there is not one formula to calculate it but a methodology to determine it. It is defined as the ability of the process to perform in a predictable manner over time. The tricky part is that a process can show good capability index today and tomorrow and not necessarily be stable next week. That is why there is a difference between short term capability using Cp and Cpk, and long term performance using Pp and Ppk. So how do we determine whether or not a process is stable?
Stability as we can observe in the above figure or as we can deduct by its definition (predictable performance over time), will have to consider two parameters: shape and position.
1. Shape will be determine by mean and variance. To be stable the process must offer constant means and constant variances, both over time. To study the consistency of variances of a process, one needs to use a scatter diagram of a sufficiently large amount of samples taking in order over a fairly long period of time. The diagram should look like a constant random variation (not positive nor negative correlation) around a constant mean, that is flat straight regression line (not positive, nor negative correlation). A large amount of samples would be at least 100. And a fair period of time would be at least 30 days.
2. Position is itself also a bit more sophisticated to determine. When we talk about position, it is relative to the specification limits. Therefore Cpk will be part of the study. Cpk is the relative position of the process mean to the upper or the lower specification limit depending upon which one is closer. But remember it must be by definition over time.
A. So to study position over time one needs to make a process distribution capability study over a fairly long period of time (daily during 30 days),
B. Calculate in particular Cpk everyday.
C. And use descriptive statistics to study the variation of the Cpk’s, since themselves they must not present a large coefficient of variation and probably be leptokurtic. That is the all point of the “predictable manner over time” definition. Indeed if the coefficient of variation of the 30 Cpk’s is large it means that the relative position is shifting too much from one Cpk to the other.
D. How much is too much shifting? 1.5 standard deviation is the answer. Therefore in determining the coefficient of variation which is equal to standard deviation divided by mean, it must be compare to the fraction of 1.5 standard deviation over mean. If the coefficient is greater than the 1.5 sigma fraction then there is too much variation and the process is not stable independently if shape was ok in the previous scatter diagram study.
As we can observe process Stability is not a simple matter. It requires time and offer some complexity as two different studies must be performed and if either one fails the stability fails, besides that the second study itself offers different ways of failing.
Stability should be obtained before any real process sustainable improvement can be obtained. This is true for any process but particularly fundamental for validation in pharmaceutical processes.
You may contact us at info@quantumtc.com to participate in a private coaching session to further explore with practical case studies this topic. Fees may be applied.


» Integración SMED y YAMAZUMI
» OEE (paradas menores) y Takt time
» Six Sigma concepts into Lean 8 Wastes
» Términos estadísticos
» Analítica de riesgo
» Cómo funciona en la práctica los cálculos de un Kanban?
» Statistics Based Kaizen
» 9 key to Productivity Improvement
» What is Lean Six Sigma?