Change Point analysis is a statistical tools that allows one to pinpoint the exact time a change has occurred in the normal life of a process, product or even someone. In our blog today we will focus on the person and show how effectively preventive it can be during this time of crisis. For this, lets suppose that one of the important symptoms of Covid-19 is fever. And for this reason an individual decided as a preventive measure to take his temperature on a daily basis when he wakes up in the morning. The following data is his temperature daily record for a period of 52 days.
It is posible to detect in real time any trend in temperature, using CUSUM and Bootstrap analysis with fairly very high level of confidence interval. First let's run the CUSUM techniques where the first data must be set to zero as well as the last data. Data in the middle are calculated on the basis of cumulative sum of the previous data to the difference of the current data with the group mean. That is applying the formula:
For example the second data of the cusum is calculated from the previous result which -0.40 plus the sum of the second temperature data which is 36.12 subtracted to the mean which is 36.39:
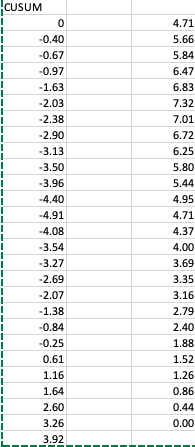
This is the result of the CUSUM:
The next step is to calculate the difference between the maximum and minimum value of the CUSUM which we will call Sdif. in this individual case Sdif is equal to 12.22 This value will be used later to calculate the confidence interval of the analysis. A graphical plot of the CUSUM data will be as followed:
In change point analysis when there is a sudden change in the orientation of the CUSUM it is concluded that there is a strong potential event resulting in a change point. Our plot shows evidence that in day number 13 the individual experiment a sudden change in his temperature and going up. this repeats on days 14, 15, and 16 which then he can be assured of the first Covid-19 symptom and is right on time to take preventive measure before it gets worse. Actually he can start on day 14, which is two days after detection of the temperature change. Then he can confirm the fever symptom by doing the second part of the change point analysis which consist of a few bootstraps to calculate the confidence interval of the his suspicious event. Notice that in the historic data there is a second sudden change corresponding to the day 34 which is probably when he was became negative again to covid-19 and back to a normal temperature.
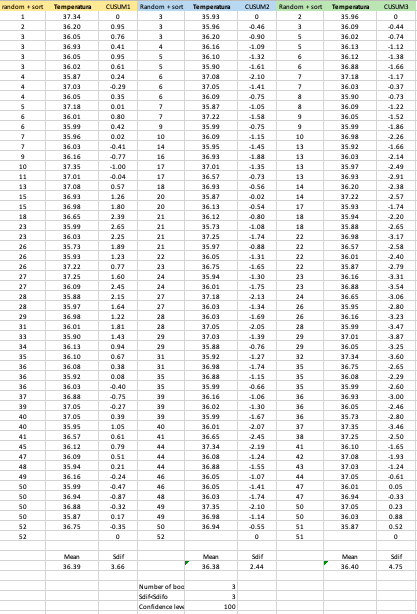
We will do 3 bootstraps to calculate its confidence interval about being infected. Bootstrap is simply a random sorting of the original data. The fastest way to do this is to generate random numbers between 1 and the number of data in the set), then place this column next to the original sequenced data and sort the random numbers column from smallest to highest expanding the selection to include the original data. This way you have a randomly sorted temperature data. From there on the next step is to calculate the CUSUM of this new random sorted data. Below is the results of the 3 bootstraps.
With these bootstraps it can now be calculated the Sdif per bootstrap and see how many are below the Sdif of the original CUSUM. This number divided into the total number of bootstraps.
In conclusion all 3 are blow the original resulting in a confidence interval of 100%. Therefore it can be stated for sure that the individual was infected on the thirteenth day and was cured of day number 34. Change point analysis can help detect exact time of change in a normal process as we may observe. In this example it can be a very useful tool for preventing further complication of the virus by monitoring the body temperature and observe for just a couple of days any drastic change of orientation of the CUSUM, which a normal plot will not show as it will appear as a simple variation of temperature within two control limits.
Feel free to use for your own safety and health. It can also be used in a large number of applications (products changing phase in their lifecycle, quality deterioration of a product or process, operators efficiency change after training, just to mention a few.
It is posible to detect in real time any trend in temperature, using CUSUM and Bootstrap analysis with fairly very high level of confidence interval. First let's run the CUSUM techniques where the first data must be set to zero as well as the last data. Data in the middle are calculated on the basis of cumulative sum of the previous data to the difference of the current data with the group mean. That is applying the formula:
Sj=Sj-1+(Xj-Xmean)
For example the second data of the cusum is calculated from the previous result which -0.40 plus the sum of the second temperature data which is 36.12 subtracted to the mean which is 36.39:
-0.40 + (36.12-36.39) = -0.67
This is the result of the CUSUM:
The next step is to calculate the difference between the maximum and minimum value of the CUSUM which we will call Sdif. in this individual case Sdif is equal to 12.22 This value will be used later to calculate the confidence interval of the analysis. A graphical plot of the CUSUM data will be as followed:
In change point analysis when there is a sudden change in the orientation of the CUSUM it is concluded that there is a strong potential event resulting in a change point. Our plot shows evidence that in day number 13 the individual experiment a sudden change in his temperature and going up. this repeats on days 14, 15, and 16 which then he can be assured of the first Covid-19 symptom and is right on time to take preventive measure before it gets worse. Actually he can start on day 14, which is two days after detection of the temperature change. Then he can confirm the fever symptom by doing the second part of the change point analysis which consist of a few bootstraps to calculate the confidence interval of the his suspicious event. Notice that in the historic data there is a second sudden change corresponding to the day 34 which is probably when he was became negative again to covid-19 and back to a normal temperature.
We will do 3 bootstraps to calculate its confidence interval about being infected. Bootstrap is simply a random sorting of the original data. The fastest way to do this is to generate random numbers between 1 and the number of data in the set), then place this column next to the original sequenced data and sort the random numbers column from smallest to highest expanding the selection to include the original data. This way you have a randomly sorted temperature data. From there on the next step is to calculate the CUSUM of this new random sorted data. Below is the results of the 3 bootstraps.
With these bootstraps it can now be calculated the Sdif per bootstrap and see how many are below the Sdif of the original CUSUM. This number divided into the total number of bootstraps.
In conclusion all 3 are blow the original resulting in a confidence interval of 100%. Therefore it can be stated for sure that the individual was infected on the thirteenth day and was cured of day number 34. Change point analysis can help detect exact time of change in a normal process as we may observe. In this example it can be a very useful tool for preventing further complication of the virus by monitoring the body temperature and observe for just a couple of days any drastic change of orientation of the CUSUM, which a normal plot will not show as it will appear as a simple variation of temperature within two control limits.
Feel free to use for your own safety and health. It can also be used in a large number of applications (products changing phase in their lifecycle, quality deterioration of a product or process, operators efficiency change after training, just to mention a few.


» Integración SMED y YAMAZUMI
» OEE (paradas menores) y Takt time
» Six Sigma concepts into Lean 8 Wastes
» Términos estadísticos
» Analítica de riesgo
» Cómo funciona en la práctica los cálculos de un Kanban?
» Statistics Based Kaizen
» 9 key to Productivity Improvement
» What is Lean Six Sigma?